


Lesson 002 - Purchasing Power
CPI, Inflation, Future Value, and Purchasing Power

My motivation and mission:
Google sheet that contains list of all WCD lessons and links to all content:
Lesson reviewing how to use Google sheet:
In Lesson 001 we covered the concepts of time value of money and compounding interest. We learned that $1,000,000 invested in 2021 can grow to roughly $17,500,000 by 2051 if invested at a compound annual growth rate of 10%. On the surface this sounds too good to be true… and it is. Just because the nominal value of your portfolio is growing does not mean that the purchasing power of your portfolio is growing.
In Lesson 002 we will cover CPI and inflation and discuss how these impact your purchasing power and your “real” future value (as opposed to your nominal future value).
Before we dive into the numbers, remember what Albert Einstein said:
“Compound interest is the eighth wonder of the world; he who understands it, earns it. He who doesn’t, pays it.”
Inflation is a hidden tax that central governments and central banks impose onto their constituents by means of yearly, compounding debasement of their fiat monetary system. Effectively, central banks print fiat money and central governments accumulate huge amounts of debt (effectively borrowing money from the future) and this combination of monetary and fiscal policy continuously erodes the purchasing power of their fiat currency (in my case it’s the US Dollar).
I suggest reading “WTF Happened in 1971?” to fully grasp how bad the above phenomena has become since the USA left the gold standard in 1971.
How Bad is Inflation?
Short answer: Deceivingly bad
The federal reserve in 2021 is “targeting” a long term 2% consumer price index (CPI). Effectively this means that the basket of goods that represents the CPI is going to increase in price (on average) by 2% every year. 2% doesn’t seem that bad, but there are a few things to consider:
2% year over year growth still grows exponentially and over long periods of time, the absolute value of the dollar erodes significantly.
The Federal Reserve defines the basket which makes up the CPI. This basket is constantly manipulated to make the numbers tell the story the Fed wants to portray. For example, in 2021, the housing/rental component of the basket was roughly 30%. Housing is 75% of my personal monthly expenses so obviously my personal CPI is incredibly different than the Fed’s definition. My friends have heard me say many times, “I don’t care what the price of bananas are! I care about the price of houses!” (and in 2020 the average home price went up 24%… a lot higher than the 5.4% CPI inflation metric everyone is talking about).
CPI is a terrible metric for tracking what “inflation” really is (see bullet point #2 for why). A much better metric is M2 money supply or the value of scarce assets like land, real estate, bitcoin, gold, etc.
Lastly, the USA is a HUGE exporter of US Dollars. This point is a bit complex. You can look at this twitter post from Tascha (@RealNatashaChe) to understand the implications better. Effectively, the USD is demanded world-wide because even though it is flawed, it is still a better store of value than the fiat currencies of corrupt governments that experience hyperinflation (#Zimbabwe). This demand of USD from external countries acts as a major damper of USD inflation. The USA is incredibly blessed to have “global reserve currency” status. If the USA ever lost this status, it wouldn’t be unreasonable to think that the USA might experience high inflation (probably not hyperinflation by definition, but there could be a few decades like the 1970’s where 10-15% inflation was the norm).
See the charts below for some historical data on CPI and M2 money supply. You will notice there was very high inflation in 1970’s after Nixon abolished the gold standard in 1971. You will also notice that CPI has averaged about 3% in the past 25 years but M2 money supply is considerably higher (roughly 5% or 6%).

CPI Inflation % - 1996 to 2021

M2 Growth Vs Inflation - 1996 to 2021

Calculating Future Purchasing Power
The personal number I use for inflation when I am doing financial forecasting is 5%. That said, the world’s monetary and fiscal response to the Covid-19 pandemic in 2020 and 2021 has me re-thinking this number. If the USA adopts a modern monetary theory policy… then this 5% inflation number is sure to increase substantially.
In the graphics below you will see the same calculations of nominal future value (NFV) that were done in Lesson 001. However, now you will see a column that calculates the “Purchasing Power Decrease Factor”. Effectively, this factor represents how much your dollar has eroded in purchasing power. If the factor equals 2, then the purchasing power of your dollar has decreased by a factor of 2 (you can now only afford 50% of the goods or services with the same nominal value of dollars).
Column #1 - Year (2021 to 2051)
Column #2 - Number of years of compounding (0 to 30)
Column #3 - Purchasing Power Decrease Factor (PPDF)
Columns #4 to #7 - Four different calculations of “Nominal Future Value” (NFV) at a given yearly rate of return (ROI).
Columns #8 to #11 - Four different calculations of “Real Future Value” (RFV) at a given yearly rate of return (ROI) and a given inflation %. This is effectively the future increase of purchasing power your $1 has gained by being invested at the respective ROI% over time (less the impacts of inflation).
Real Future Value = Nominal Future Valve / Purchasing Power Decrease Factor
RFV = NFV / PPDF
Scenario 1
This scenario shows ROI's between 5% and 20% with an inflation of 3% which has been the average CPI inflation % over the past few decades.
You will notice that even though your nominal future value of that $1.00 in 2021 might have grown to $17.45 dollars in 2051 (if invested at 10%), the purchasing power of each dollar has reduced by 2.43x which means the Real Future Value is $7.19. That’s still a 7.19x increase!


Scenario 2
This scenario shows ROI's between 5% and 20% with an inflation of 5% which has been the average M2 money supply % increase over the past few decades.
In this case, if you look at the 5% ROI case, you will notice the purchasing power stays at $1 the entire time. That’s because your nominal future value is increasing at the same rate as inflation is decreasing your purchasing power.
Again, I typically use 5% as my inflation number when doing financial forecasting.
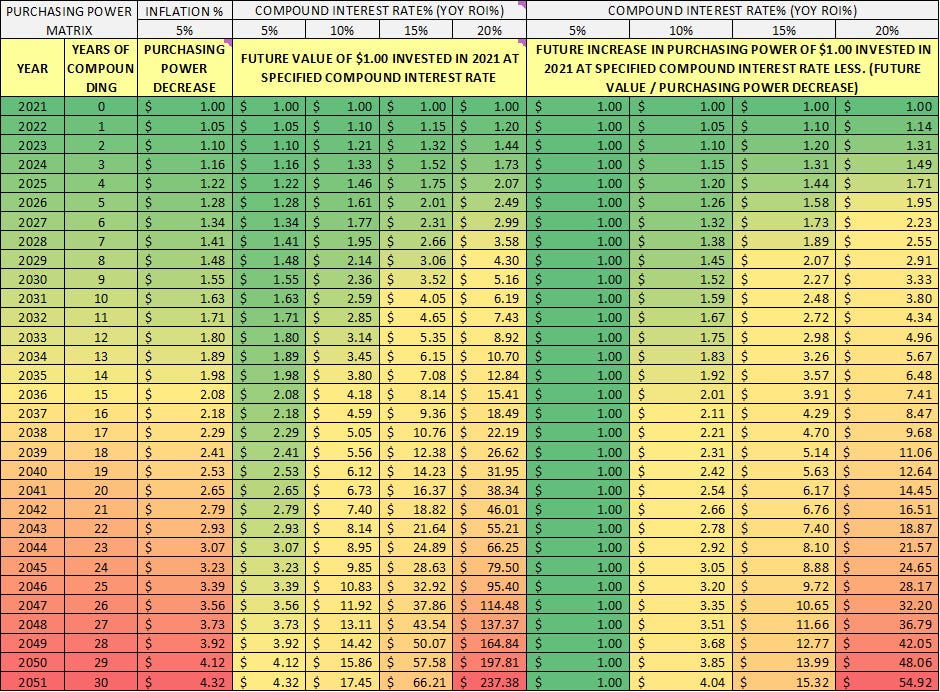

Scenario 3
This scenario shows ROI's of 0%, 1%, 3% and 10% with an inflation of 5% which has been the average M2 money supply % increase over the past few decades.
I selected these ROI’s specifically because they represent the following investments:
0% - Cash - If you hold onto cash your whole life, then your ROI is 0%. Your RFV will be very small.
1% - The 10Y Treasury Yield in 2021 is roughly 1%
3% - The 30Y Treasury Yield in 2021 is roughly 3%
10% - The S&P 500 averages roughly 10% year over year growth over long periods of time.
It doesn’t take a genius to see that cash and bonds are not a good long-term strategy for wealth creation… in fact, the real future values of these investments are actually below 1. Effectively, if your ROI% is less than the inflation %, then your purchasing power will decrease over time.
In this example, if you held onto cash for 30 years, your purchasing power of the $1 you held onto from 2021 to 2051 would be 0.23x what it was in 2021. This means you would only be able to buy 23% of the goods or services you could afford in 2021.
I would much prefer the alternative of being invested in the S&P 500 over 30 years where my purchasing power would have increased by 404%.

Summary
Inflation is a hidden tax. Federal governments and central banks are debasing their currencies every year. Current policy trends are pointing to an accelerating debasement in the future. Additionally, the CPI metrics that are used to record “inflation” are misleading, misrepresentative, and are arguably an intentional attempt for hiding the real debasement of the fiat currency.
If you fail to save money and invest it at a higher ROI% than the inflation %, your real purchasing power will decrease over time.
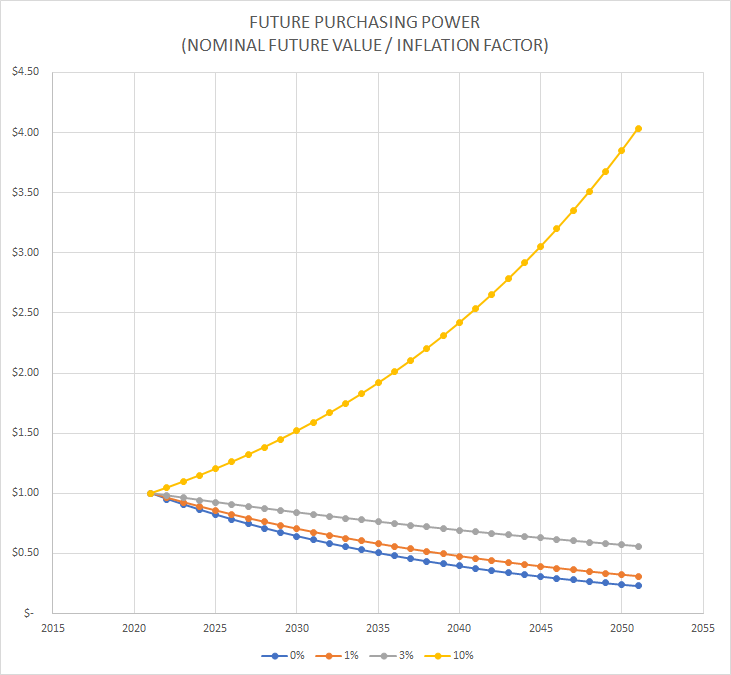
Below is a matrix and a graph that shows how significantly a currency can lose value over 30 years given inflation rates between 1% and 10%. I suspect the USA is somewhere in the middle.
The good news is the accessibility to the Stock Market, Bitcoin, and Real Estate have never been easier. A primary reason people stay poor is because they lack financial education/awareness and don’t have an appreciation for how significantly their savings accounts are getting depreciated each year.


Reference Material & Social Media
In Lesson 030 I cover how to navigate and utilize the Google Sheet I have built for all WCD lessons. This Google Sheet contains a worksheet for each WCD lesson. Each sheet has all of the Excel calculations, tables, graphs, and charts that I have posted in the respective WCD lesson. Additionally, the Google Sheet has a master “Index” worksheet that has links to all of the content associated with each lesson.
If you found this post helpful, please like, share, and follow me on my social media channels!