


Crypto Crash - 2021.01.22
On-chain Data Update

My motivation and mission:
Google sheet that contains list of all WCD lessons and links to all content:
Lesson reviewing how to use Google sheet:
Intro
Anyone who is invested in cryptocurrencies at the moment is keenly aware the prices have been steadily decreasing for the past several months since the Federal Reserve hinted that they were about to raises rates and begin tapering the quantitative easing (QE).
The change in federal reserve policy hasn’t taken effect yet, but market participants have been selling all risk-assets in an attempt to get out of the way before anything happens. High Beta risk assets like cryptocurrencies and growth-stocks have been hit the worst. Many of these assets are down 50-90% already.
The new Federal Reserve policy will certainly decrease liquidity, but it’s my belief that current selling is overdone and now is continuing due to human emotion and forced liquidation.
There has definitely been an increase in the use of margin and leverage by retail investors in the past couple years and I believe the price drops in the last week reflect retail investors getting margin called or capitulating.
The on-chain data for ETH and BTC can give us a glimpse at the human emotion variable and can help us decide if ETH and BTC are a good risk/reward at their current prices.
On-Chain Data (Glassnode)
In Lesson 034 I describe these metrics in more detail. For details on what each metric represents, read Lesson 034.
MVRV
MVRV is perhaps the simplest but also most important metric as it is a good indication of when people will begin profit taking.
MVRV = MV / RV
MV = Market Value = Market Cap (Total supply of coins * Today’s Price)
RV = Realized Value = Realized Cap (Total supply of coins * Price Purchased). Effectively, this is the sum of everyone’s cost basis.
I have noticed a trend of MVRV trading between 1.5 and 3.0. There have been times where MVRV was above or below this range, but a large majority of price action causes MVRV to stay in this range.
The ETH and BTC MVRV are now approximately 1.5. This is the lowest level in a year. This is the level it bounced off in July.
ETH

BTC

My interpretation is that when MVRV reaches 3.0, whales and institutions begin showing financial discipline and start taking profits. When MVRV reaches 1.5, this is enticing enough for new participants to begin buying and low enough that whale and institutions stop selling.
If you want a super simple strategy for trading crypto:
Sell some of your stack at MVRV 2.5 to 3.0
Add to your position at MVRV less than 2.0
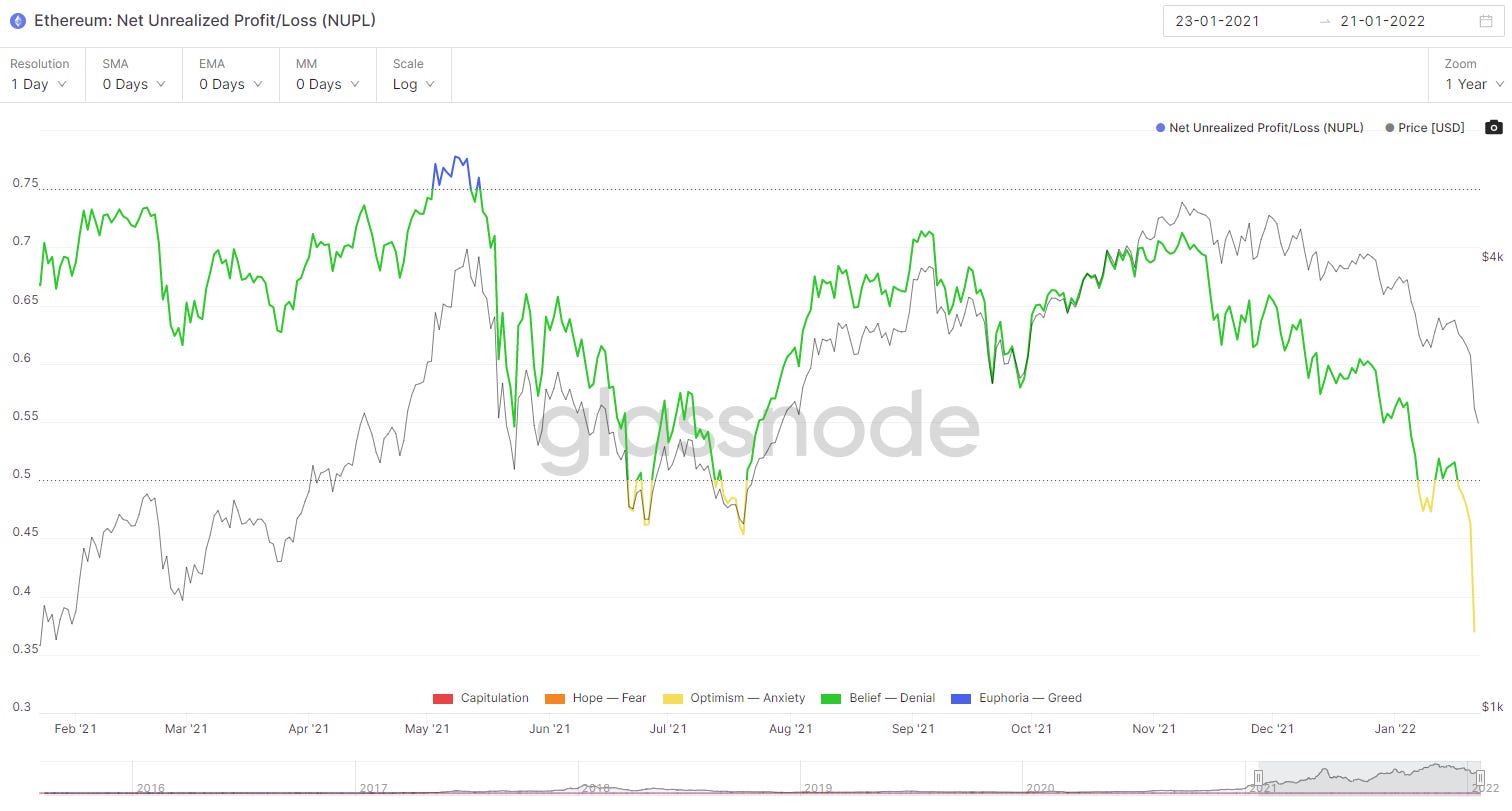
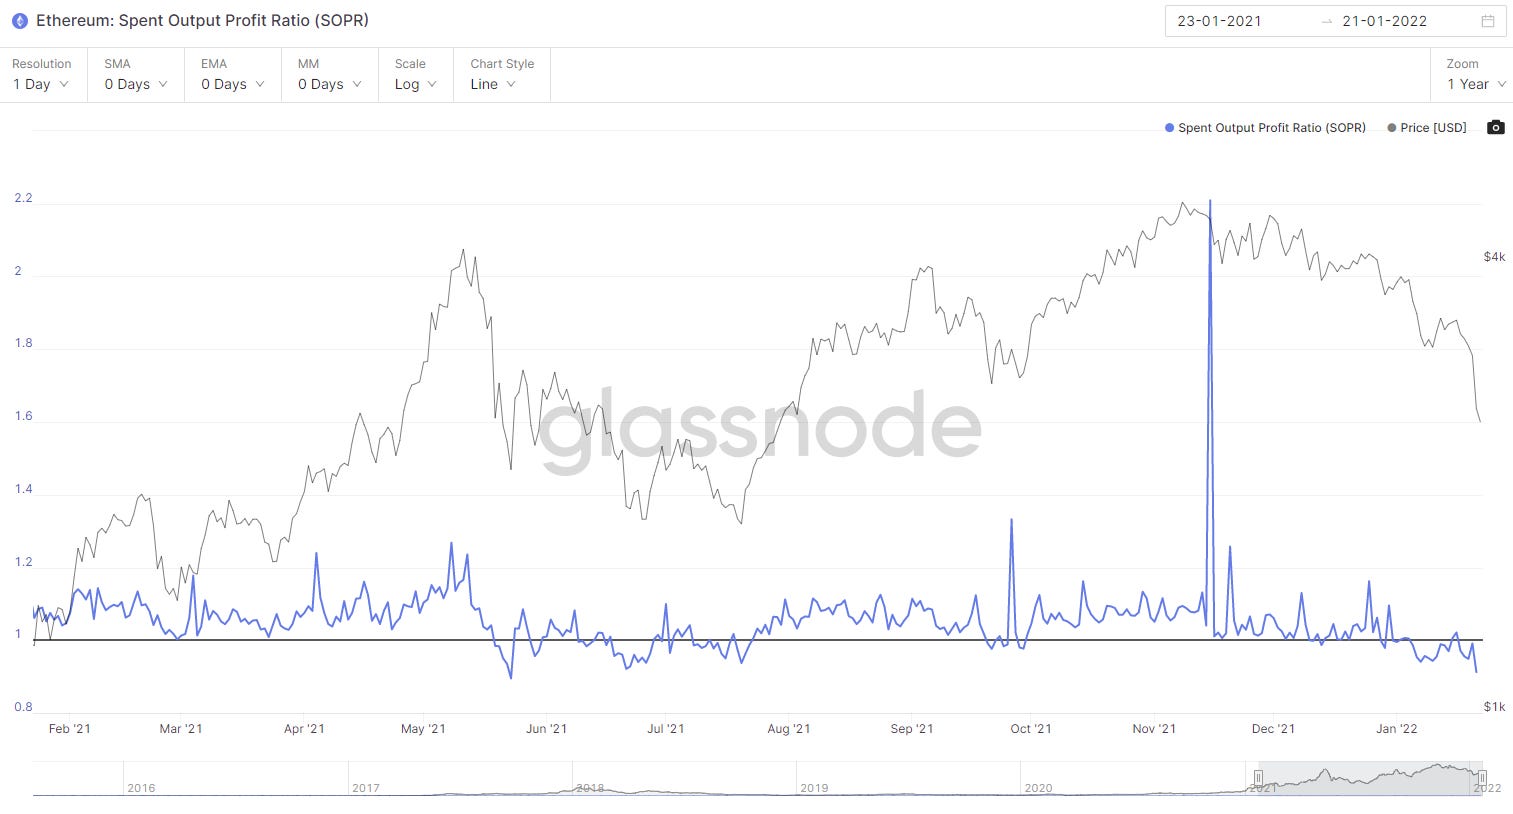
NUPL and SOPR
The current NUPL and SOPR levels show that investors are about as fearful as they were back in July. There is definitely a lot of people selling for a loss. This either means they are capitulating or they are being forced to liquidate.
ETH NUPL - Significantly lower than where it was in July
BTC NUPL - Back to same levels in July

ETH SOPR - Below 1.0 - People selling for a loss
BTC SOPR - Below 1.0 - People selling for a loss

Summary
The yield curve has already priced in the interest rate hikes that will occur later this year and next year. The selling that is happening now is emotional and/or being forced due to retail investors who overused margin and leverage.
According to the on-chain data, I think the current prices are phenomenal entry points for new market participants or for existing participants to add to their position.
There could be continued selling as the amount of margin and leverage that was utilized in the past two years was at historic highs. However, once the margin and leverage is flushed out, I would expect prices to return to levels where the MVRV is between 1.5 and 3.0.
Crypto is still in the very early innings of the adoption curve. If you believe in human ingenuity and continuous improve in technology, then it’s easy to be an optimist about crypto over the next decade or two.
Volatility is the norm. Downside volatility sucks and causes even experienced investors to get emotional and question their conviction. In the end, the upside volatility is worth the sacrifice of experiencing the downside volatility!
Reference Material & Social Media
In Lesson 030 I cover how to navigate and utilize the Google Sheet I have built for all WCD lessons. This Google Sheet contains a worksheet for each WCD lesson. Each sheet has all of the Excel calculations, tables, graphs, and charts that I have posted in the respective WCD lesson. Additionally, the Google Sheet has a master “Index” worksheet that has links to all of the content associated with each lesson.
If you found this post helpful, please like, share, and follow me on my social media channels!