


Lesson 035 - ETH On Chain Analysis (Market Update)
Updated Glassnode Charts For ETH

My motivation and mission:
Google sheet that contains list of all WCD lessons and links to all content:
Lesson reviewing how to use Google sheet:
Lesson 035 isn’t going to go into nearly as much detail as L-34 - BTC/ETH - ON CHAIN ANALYSIS. Lesson 034 reviewed all of the important metrics in great detail and explained how to use them to make investing decisions.
Topics - Lesson 035
I will be posting on-chain analysis updates on two different days:
Sep 7, 2021
Sep 7, 2021 (El Salvador Bitcoin Day) - There was a 20% drop in BTC & ETH
Sep 19, 2021
Sep 19, 2021 - About two weeks after the drop - To see if the ~20% drop has changed the behavior of investors. On-chain analysis isn’t very good for day-to-day; there is too much noise. It normally takes a couple weeks to spot a real trend.
My price prediction for Q4 2021
At the end of this post I cross reference the on-chain data with technical analysis to make my price prediction for ETH by the end of Q4 2021.
Data Metrics
Exchange Net Flow Volume
Exchange Net Position Change
MVRV Ratio (my favorite metric)
SOPR
NUPL
HODL Waves
ASOL
Market Update: Sep 7, 2021
This was done immediately after the 20% drop in ETH and BTC on El Salvador’s Bitcoin day. I definitely think there was some geopolitical stuff happening (e.g. a BTC Whale accumulated Bitcoin for a while just to dump it on the day El Salvador officially made BTC a legal currency to try and scare people of the volatility).
For these charts, I won’t be using any moving averages and I will be looking at a shorter time horizon to see if we can identify a daily-movement. Daily movements aren’t the best use of on-chain analysis, but the drop was significant enough that we might see something.
Exchange Net Flow Volume

Small up-tick in exchange net-inflows.
Exchange Net Position Change

Small up-tick in exchange net position (The 30d change of the supply held in exchange wallets… this by default is a moving average built into the metric.)
MVRV Ratio
MVRV Z-Score isn’t available for ETH. Just MVRV.
MVRV - Past 6 Months

MVRV at the peak in May = 3.63 @ $4,172
MVRV at the current, local peak = 2.87 @ $3,950
Remember that MVRV = MV / RV
MV = Market Cap
RV = Realized Cap
You could also evaluate this per coin as…
MV = Current Price Per Coin
RV = Average Cost Basis Per Coin
So I am am to calculate the average cost basis of the two points in time above:
Peak in May = $4,172 / 3.63 = $1,149
Current, local peak = $3,950 / 2.87 = $1,376
Effectively, the average cost basis has risen about 20%
If we assume people will start taking profits around the same MVRV as the peak in May, then the price of ETH would be $1,376 * 3.63 = $4,995.
All-Time MVRV Chart

I wouldn’t use the MVRV of the distant past because the psychology has changed dramatically because people’s cost basis was incredibly low 4-5 years ago. But if you look at the peaks in the past year, they occur at:
MVRV = 3.25
MVRV = 3.18
MVRV = 3.63
If you use our new calculated average cost basis per coin of $1,376, then the resulting price of ETH would be:
MVRV = 3.25 >> ETH = $4,472
MVRV = 3.18 >> ETH = $4,376
MVRV = 3.63 >> ETH = $4,495
MVRV is a metric that evaluates people’s psychology on when they start taking profits. A lot of old school money managers might tell you to sell 50% of your cost basis if you get a 2x (aka MVRV = 2).
If people’s psychology stays the same, I would expect some profit taking to start occurring between $4,400 and $5,000.
Will this profit taking flood the market with more supply than new incoming demand?
I don’t know.
ETH’s supply is literally being burned and when you factor in the amount getting locked up in ETH2, it’s easy to think that in the long run, the demand will outpace supply, and the price can continue to rise (even long term holders take profits).
What gives me hope is that the RV (the average cost basis) has increased 20% in just 4 months. If the RV continues this trend… you don’t need an increase in MVRV to make money. MVRV can stay flat and the increase in RV will drive the price of ETH higher.

Obviously assuming 20% every 4 months is an aggressive assumption. Let’s see what it looks like if I taper that assumption.

Still looks pretty good to me! Especially considering that both calculations above assume that the ETH supply stays fixed. ETH is actually getting burned after EIP-1559 and the supply is decreasing.
SOPR
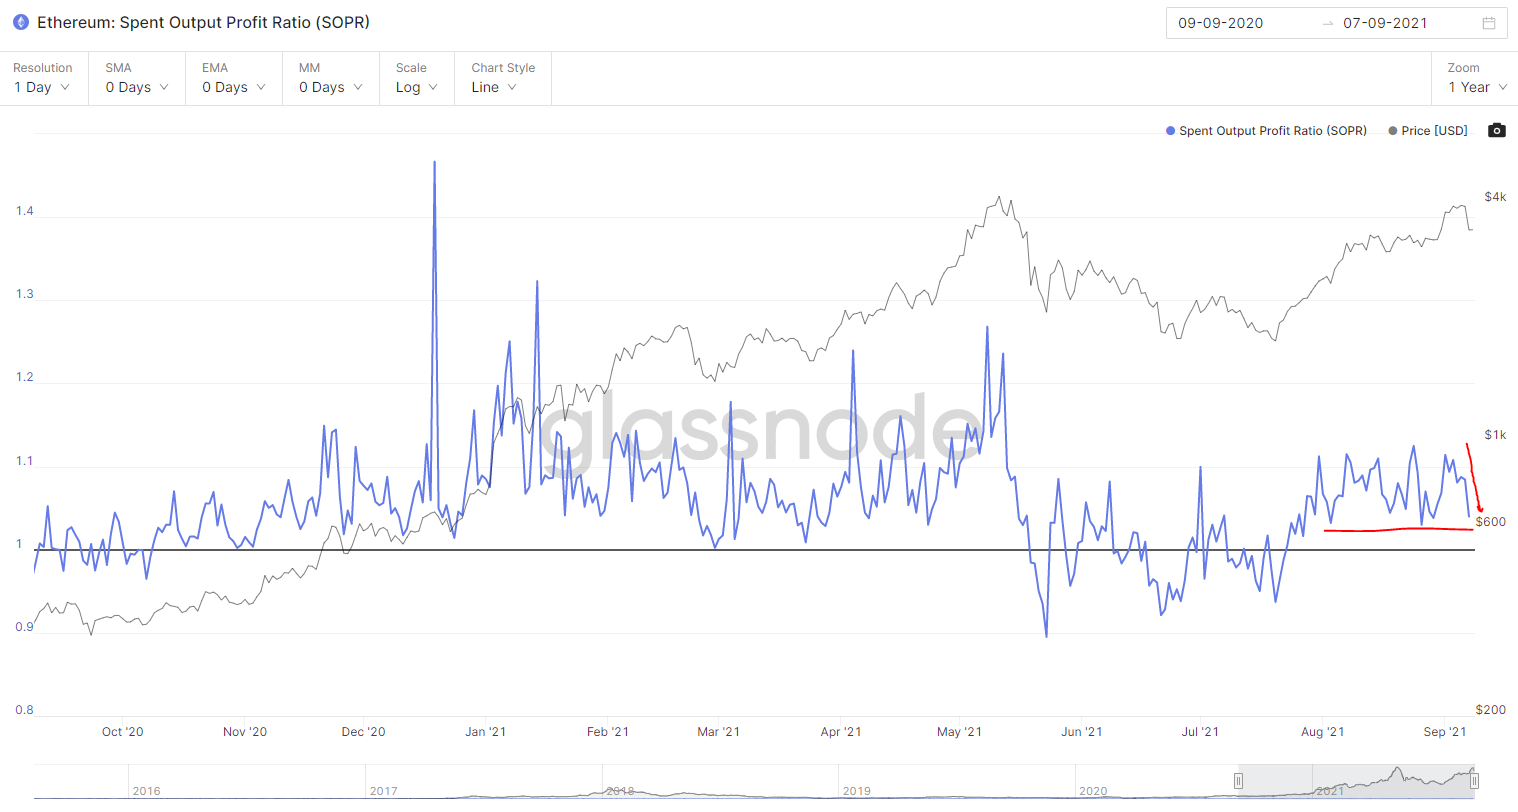
There was a down-tick in SOPR. I’m not a big technical analysis guy, but there does look like a local support in the SOPR metric. I’ll be interested to see if it bounces off this support or breaks it.
Spent Output Profit Ratio (SOPR) is computed by dividing the realized value (in USD) divided by the value at creation (USD) of a spent output. Or simply: price sold / price paid.
NUPL
NUPL = (MV - RV) / MV
MVRV = MV / RV

NUPL and MVRV tell me basically the same thing. I prefer MVRV because it fits better with how I think about profit taking. When I trim positions, I think about doing it at 2x, 3x, 4x, 5x, 10x, 15x, 20x, 30x, 40x, 50x, 100x. These multiples correspond directly with MVRV.
The math is a bit different for NUPL, but the story is the same. See calculations I did under MVRV. The RV of ETH has risen about 20% in 4 months. RV can be thought of as the total cost basis of everyone.
HODL Waves

HODL waves definitely need a much longer time period that one day to spot a trend. I will be checking this on a weekly or monthly basis to see if short-term-holders start to ramp up and the next HODL wave begins.
ASOL


Very small up-tick in ASOL. Nothing to be worried about. Old coins weren’t responsible for the drop on El Salvador’s Bitcoin day. I will continue to monitor this to see if there is an increase in activity of old coins after this event.

Market Update: Sep 19, 2021
This was done a couple weeks after the 20% BTC & ETH drop on El Salvador’s Bitcoin day. It normally takes at least a week before you can see through the noise and spot a real trend using the on-chain data.
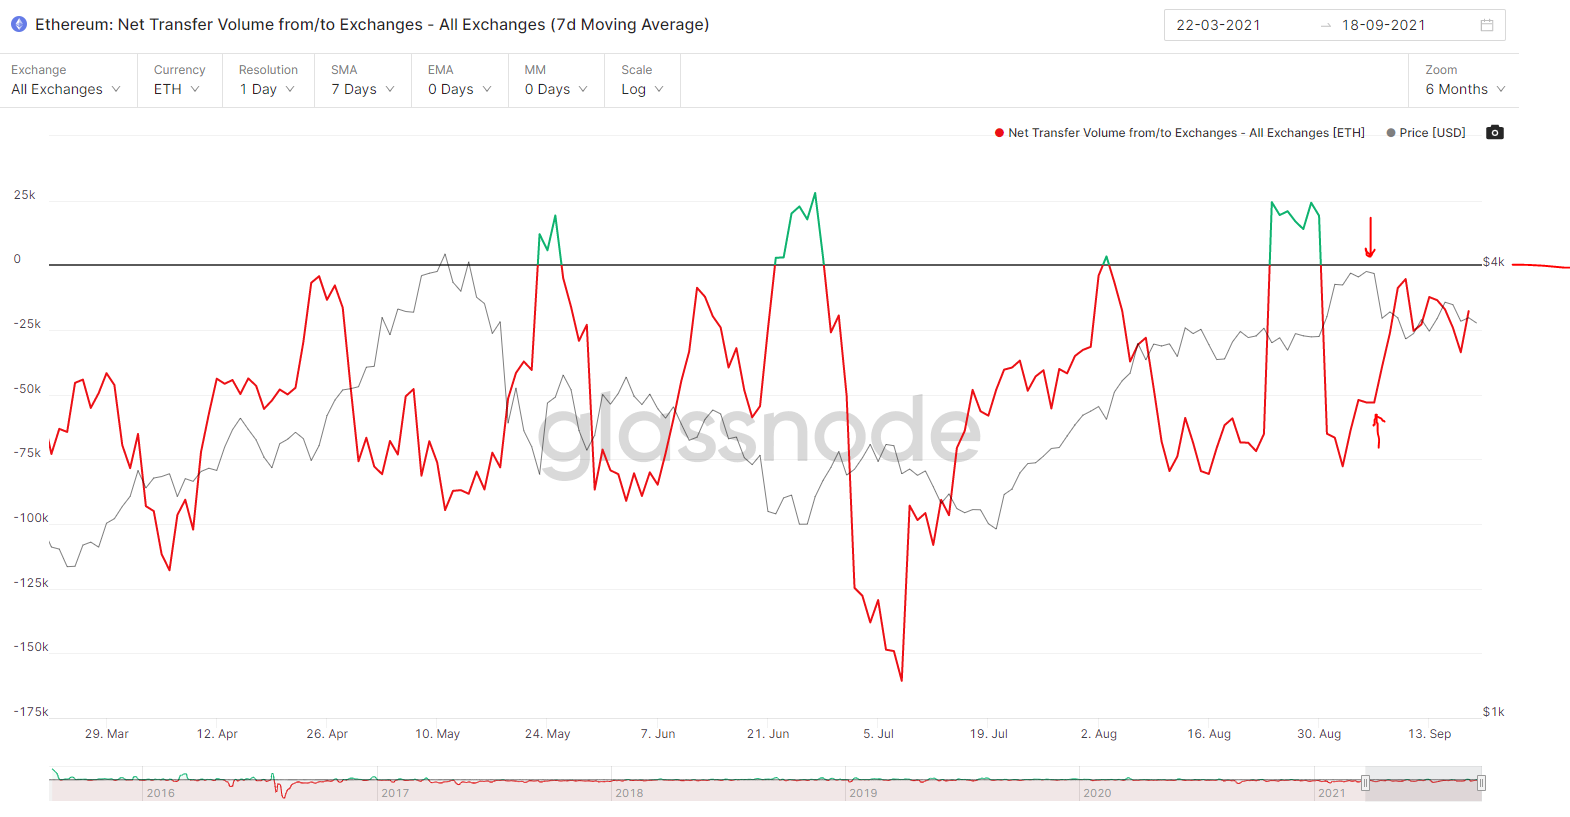
Exchange Net Flow Volume
There was a spike up in net inflow volume the day of the 20% drop and this increased for a couple of days, but the trend is still negative meaning that coins are still flowing off of exchanges. There is nothing about the net flow volume that concerns me at all.
Exchange Net Position Change
This is a similar story to exchange net flow volume. This is basically the first derivative (the rate of change) of the supply held on exchanges. Note that this metric has a 30-day simple moving average built into it.

The main take-aways are:
The absolute net position change is still negative (more and more coins are moving off of exchanges).
There were about 10-days around the 20% sell-off where this metric was becoming less and less negative (upward sloping trend), but this has reversed in the last few days. The last time this inflection point happened, ETH increased in price from about $3250 to $3950.

MVRV Ratio
I went into a lot of detail about how to use this metric at the top of this post under the Sept 7th, 2021 update.
The main take away is that profit taking has historically occurred around 3-4 in the past year and 4-6 in previous cycles.
MVRV is sitting around 2.45 so I could easily see ETH increasing 50% to 100% before serious profit taking occurs again.

Recent spikes of MVRV are around 3.2 to 3.6

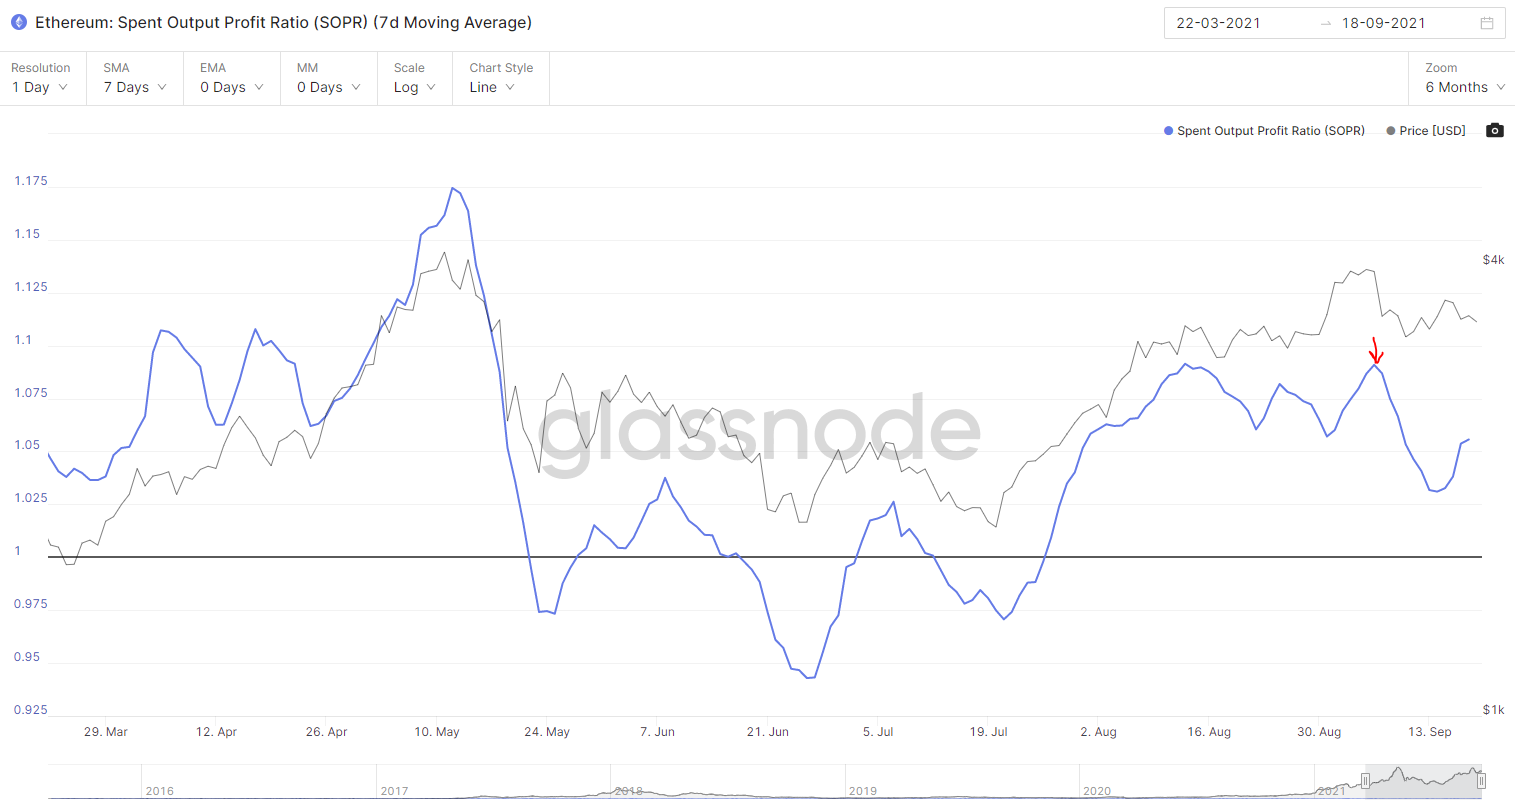
SOPR
The Spent Output Profit Ratio (SOPR) = Price Sold / Price Paid. This metric tells you how profitable someone is when they sell their coins. There does appear to be a relatively sharp decrease in the past couple of days for only a small decrease in price. My thoughts on this is that short-term trades with a relatively high cost basis exited their position.
The main thing I look at SOPR for is capitulation. If SOPR ever breaks below 1, then it tells you people are selling for a loss. As long as this metric stays above 1, then I don’t pay much attention to it.
No moving average

7-day simple moving average
NUPL
I think MVRV is a better metric for identifying top and bottom of markets. It looks like there is still plenty of room for ETH to increase before a top occurs.

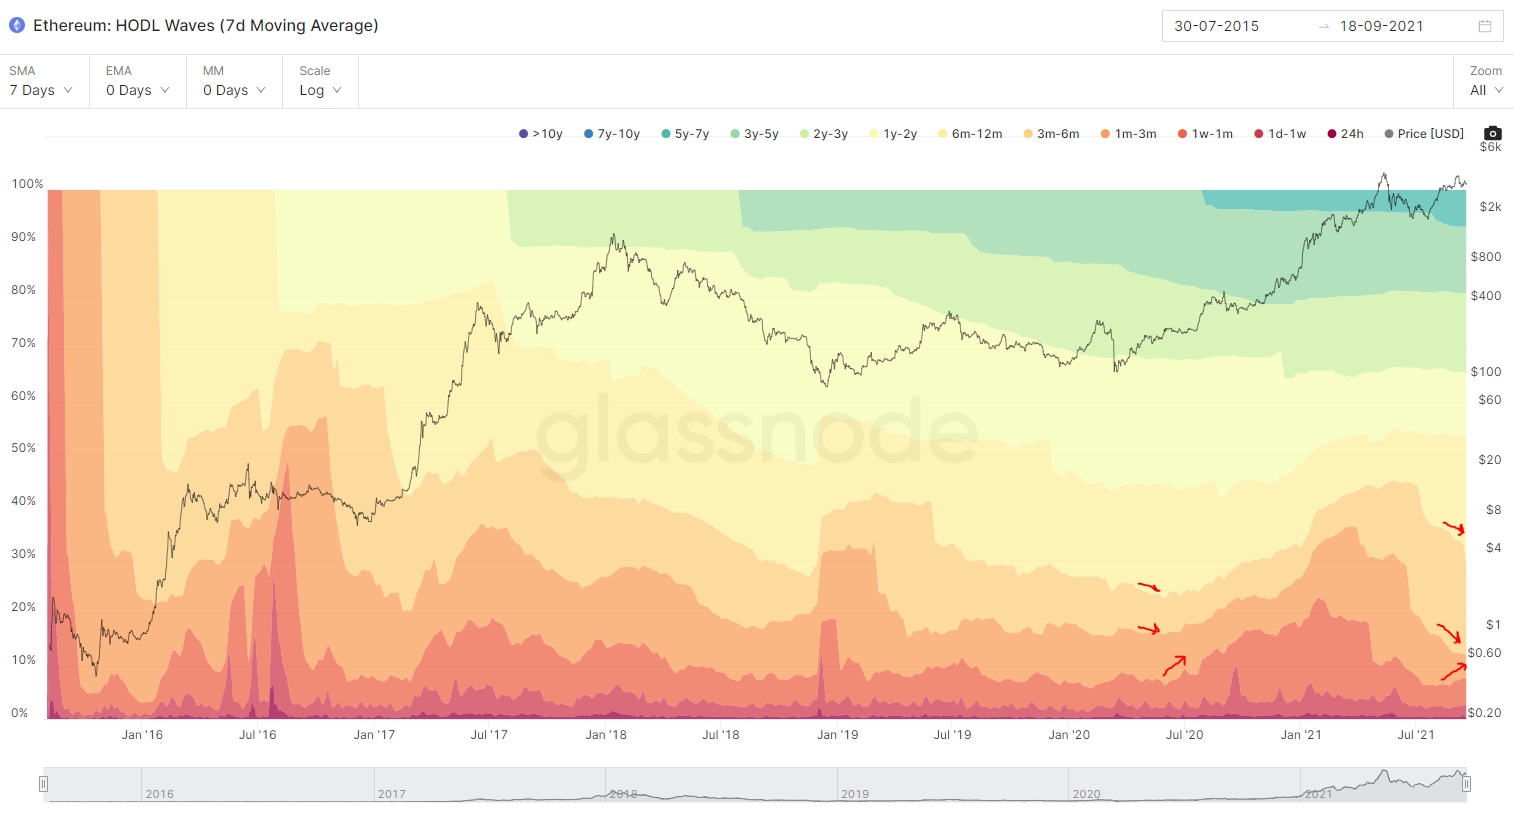
HODL Waves
Out of all of the metrics, HODL waves have me the most excited for Q4 of 2021. Here is why:
Long-term HODLers are aggressively adding to their positions (the dark green band at the top has significantly increased in the past couple months)
It looks like the formation of a new HODL wave is beginning. It looks similar to June of 2020. The ultra-short term traders are the first group that inflect upwards.
The combination of short-term traders piling in at the same time that long-term HODLers are adding to their position could lead to an EPIC supply shock. If you factor in ETH is getting burned after EIP-1559 and a large portion of ETH is getting staked on ETH 2.0… there could be another massive Q4 like what happened in 2017.
I am definitely keeping my eye on this trend to see if it continues.
ASOL
Average Spent Output Lifespan (ASOL) tells you the average age (in days) of spent transaction outputs.
In simpler terms, ASOL is the average age of coins being moved on a given day. If you see this number starting to rise, then it means longer term holders are becoming more active.
There was a little spike in ASOL, but nothing crazy. This number is now coming back down.
Nothing note worthy here.

Technical Analysis & Q4 2021 Prediction
I don’t consider myself a trader or an expert at technical analysis, but I do think technical analysis is a valuable skill to learn. At very least, it tells you what traders are looking at and can help explain a lot of the price action you see day to day or week to week.
See below for the current chart on ETH/USD.

My Prediction
A scenario that I see as likely, based on technical analysis and on-chain analysis is the following:
Bollinger Bands continue to tighten as ETH trades sideways (this typically indicates a big move in one direction).
ETH hits the bottom of the Bollinger Bands ($3150 to $3200)
ETH bounces from the bottom of the band to the top of the band (happens very frequently with Bollinger Band analysis. This could make ETH hit $3800 to $4000 depending on how much the bands widen.
This price action will cause a lot of short-term traders to begin entering the market.
The supply shock from EIP-1559, ETH 2.0 staking, LTHs HODLing, and STHs piling-in will cause an epic HODL wave and ETH will break it’s old ATH and enter price discovery.
Once ETH enterers price discovery, the price could reach levels such that MVRV equals 4-6 before massive profit taking occurs (based on today’s RV of $1,400 this would mean ETH would reach $5,600 to $8,400 before major profit taking occurs).
Summary
The 20% drop in ETH and BTC was a bit unsettling for newcomers, but for long-term HODLers like myself, it’s just another day. The on-chain data and the ETH chart both look very good to me and we could see an EPIC Q4 of 2021.
Stay calm and HODL on!
Reference Material & Social Media
In Lesson 030 I cover how to navigate and utilize the Google Sheet I have built for all WCD lessons. This Google Sheet contains a worksheet for each WCD lesson. Each sheet has all of the Excel calculations, tables, graphs, and charts that I have posted in the respective WCD lesson. Additionally, the Google Sheet has a master “Index” worksheet that has links to all of the content associated with each lesson.
If you found this post helpful, please like, share, and follow me on my social media channels!